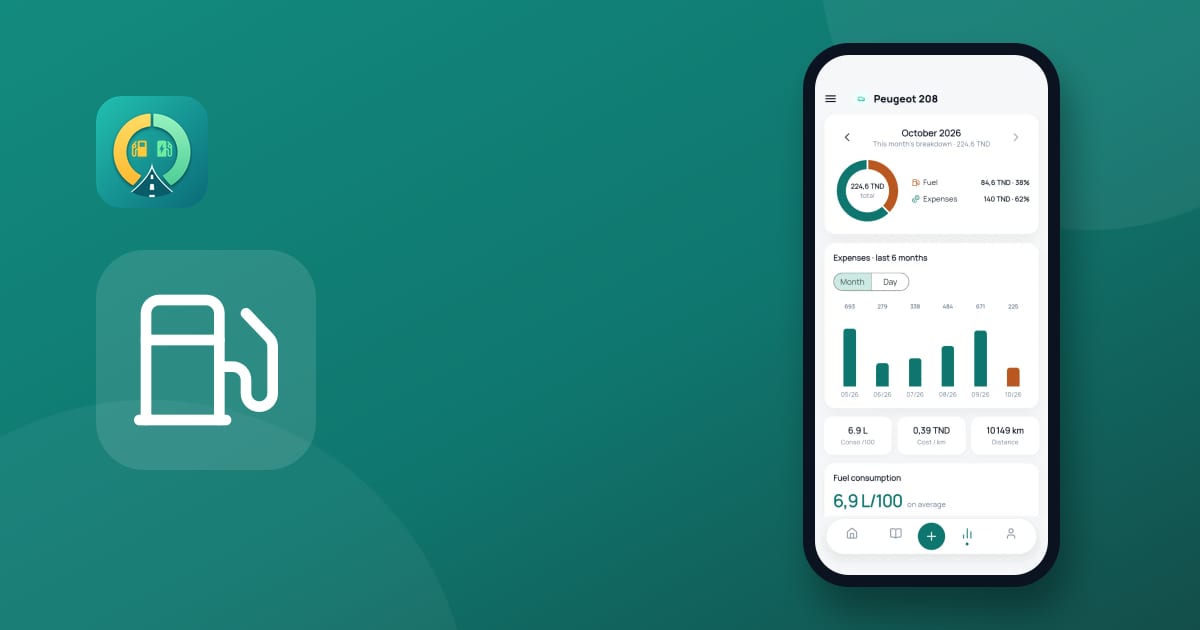
A one-off calculation gives you a number. A regular fuel consumption tracker gives you a trend: you see whether the car uses more than before, whether winter is dragging the average up, or whether a fill-up was entered wrongly. This article covers the method, a layout you can rebuild in any spreadsheet, and where spreadsheets fall short. For the basics (odometer pitfalls, what makes the figure vary), start with our guide on how to calculate your car's fuel consumption.
The L/100 km formula with the full-tank method
The method relies on two consecutive full tanks: fill up until the first click of the nozzle, note the odometer, drive, then fill up completely again and note the litres added.
Consumption (L/100 km) = litres added at the second fill ÷ km driven × 100
Example: 29.25 L added after 450 km gives 29.25 ÷ 450 × 100 = 6.50 L/100 km. The litres added at the second fill equal the fuel burned between the two fills, because the tank is back at the same level.
Other units
The same measurement can be written in km/L (100 ÷ L/100 km) or miles per gallon. 6.50 L/100 km is about 15.4 km/L, 36.2 US mpg or 43.5 imperial mpg. A lower L/100 km figure means less fuel used; it is the opposite for km/L and mpg.
Example with a partial fill
You fill up completely at 10,000 km. At 10,300 km you add 15 L without filling the tank. At 10,600 km you fill up completely again: 25 L. Over 600 km you added 15 + 25 = 40 L, so 40 ÷ 600 × 100 = 6.67 L/100 km. Dividing only the last 25 L by 600 km would give 4.17 L/100 km, which is wrong. The rule is simple: add up every litre poured between two full tanks, top-ups included.
A free layout to copy into your spreadsheet
Open Excel, LibreOffice or Google Sheets and create one row per fill-up with these columns: date, odometer, litres, price per litre, total paid, full tank (yes/no), km since the previous full tank, and L/100 km. Here is a sample, in Tunisian dinars (TND) for illustration:
| Date | Odometer (km) | Litres | Price/L (TND) | Total (TND) | Full tank | Km driven | L/100 km |
|---|---|---|---|---|---|---|---|
| 02/10 | 41,200 | 38.0 | 2.500 | 95.00 | yes | — | — |
| 14/10 | 41,650 | 29.25 | 2.500 | 73.13 | yes | 450 | 6.50 |
| 27/10 | 42,190 | 37.8 | 2.500 | 94.50 | yes | 540 | 7.00 |
| 05/11 | 42,700 | 33.66 | 2.500 | 84.15 | yes | 510 | 6.60 |
| 08/11 | 43,260 | 39.2 | 2.500 | 98.00 | yes | 560 | 7.00 |
Formulas, assuming headers in row 1 and the first fill-up in row 2: total in E3 =C3*D3, km driven in G3 =B3-B2, consumption in H3 =C3/G3*100. Fill down. For the overall average, do not average the L/100 km column: divide total litres by total kilometres. Here: (29.25 + 37.8 + 33.66 + 39.2) ÷ (450 + 540 + 510 + 560) × 100 = 139.91 ÷ 2,060 × 100 = 6.79 L/100 km. The first fill-up is only a starting point.
At the example price, those 2,060 km cost 139.91 × 2.5 = 349.78 TND in fuel, about 16.98 TND per 100 km. To put this in your overall budget, try the site tools and the car cost page.
Reading the results
A single row says little: a fill-up is never exact to the litre. Look at the average over several months instead. If it climbs with no change in your routes, look for the cause. The U.S. Department of Energy says aggressive driving can lower gas mileage by roughly 15% to 30% at highway speeds and 10% to 40% in stop-and-go traffic [1], and that results vary with the driver, conditions, maintenance and weather [2]. These are U.S. orders of magnitude, not values for your car: your own history is the reference.
The limits of a spreadsheet
- Forgotten fill-ups. A fill-up you did not log distorts the next interval: litres are missing, so consumption looks too low.
- Partial fills. You must add top-ups by hand and only conclude at the next full tank. A simple row-by-row formula does not do that.
- Typing errors. A misplaced decimal or a wrong odometer produces a 1.7 or a 34 L/100 km that drags the average, with no warning.
- No reminders. A spreadsheet will not warn you about the next oil change or the technical inspection.
- Entry at a desk. You retype receipts later, so some get lost.
How LoggyCar tracks consumption
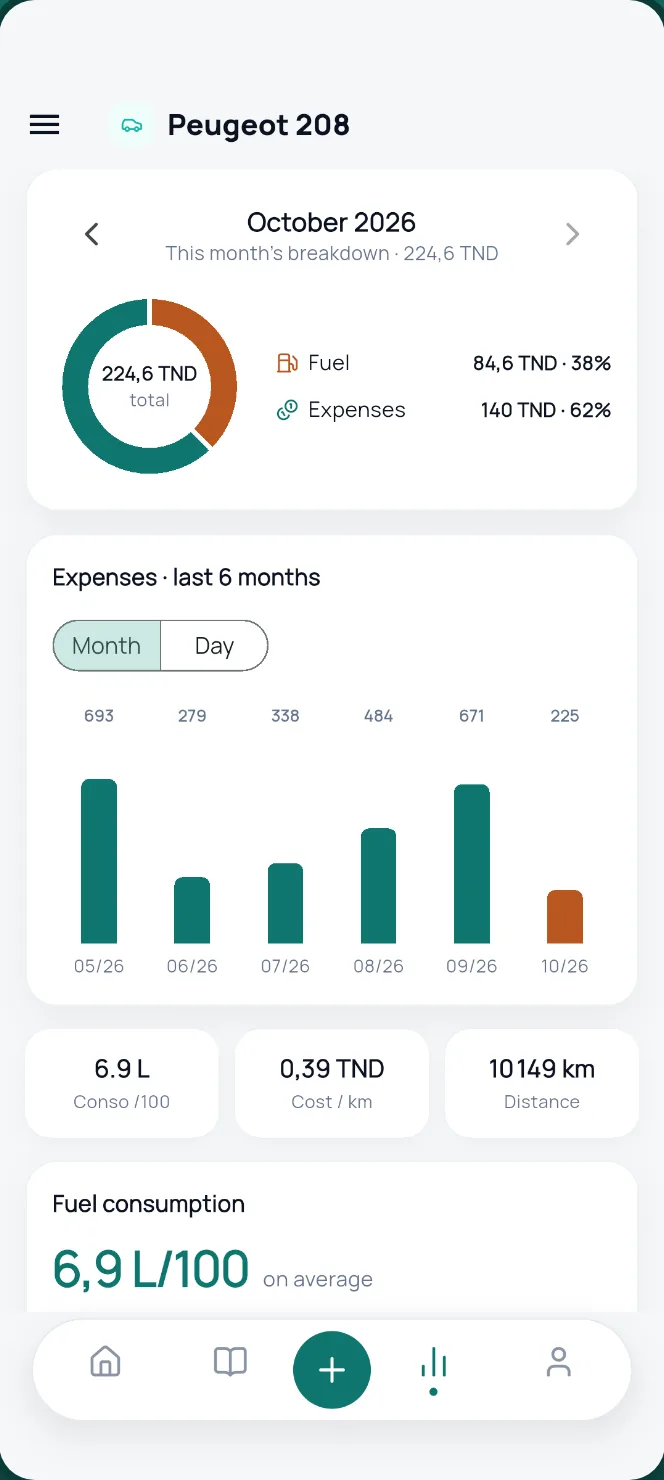
In LoggyCar, you log each fill-up with the odometer, litres and price, and tick “Full tank” when the tank is filled. The app applies the method above: between two full tanks, it adds up the litres poured, top-ups included, and divides by the km driven. Fill-ups are sorted by odometer.
- Previous fill-up missed. A dedicated checkbox says you did not log the fill-up before this one: that interval is not measured and the calculation restarts from this fill-up.
- Outliers. With at least 4 measurements, a fill-up outside half to double the median is flagged as an outlier (tank wrongly marked full, odometer error). It stays in the average but is left out of the records, the last fill-up and the charts.
- Warning when entering. A volume above the tank capacity (with a 5% margin) or a price per litre far from the last price triggers an alert before saving.
- Units. In Profile: L/100 km, km/L, US mpg or UK mpg.
- Statistics. Weighted average, last fill-up, best and worst fill-up, cost per 100 km, average distance between fill-ups and a monthly curve over 12 months. After a full tank, a message compares it with your average.
- Top-ups only. Without any full tank, an estimate is available from 3 fill-ups and 300 km.
Maintenance reminders (oil change, technical inspection) live in the same app. See the features page. A spreadsheet remains valid if you keep it up to date; the app mostly helps you forget nothing.